A A+ A++

AI in medicine: Deep Learning

AIM OF THE LAB

to test whether the deeper the network (i.e. one with more layers), the greater the accuracy in recognizing tumor subtypes in medical images

TASK

Let's prepare several deep networks (which will differ in the number of layers) to recognize the type of brain tumor in MRI images.

Our models will be designed to identify brain tumors or their absence in magnetic resonance imaging (MRI) images. The dataset includes four classes: glioma tumors, meningioma tumors, pituitary tumors, and healthy (no tumor) brain. 

tumorsv2

APP MANUAL

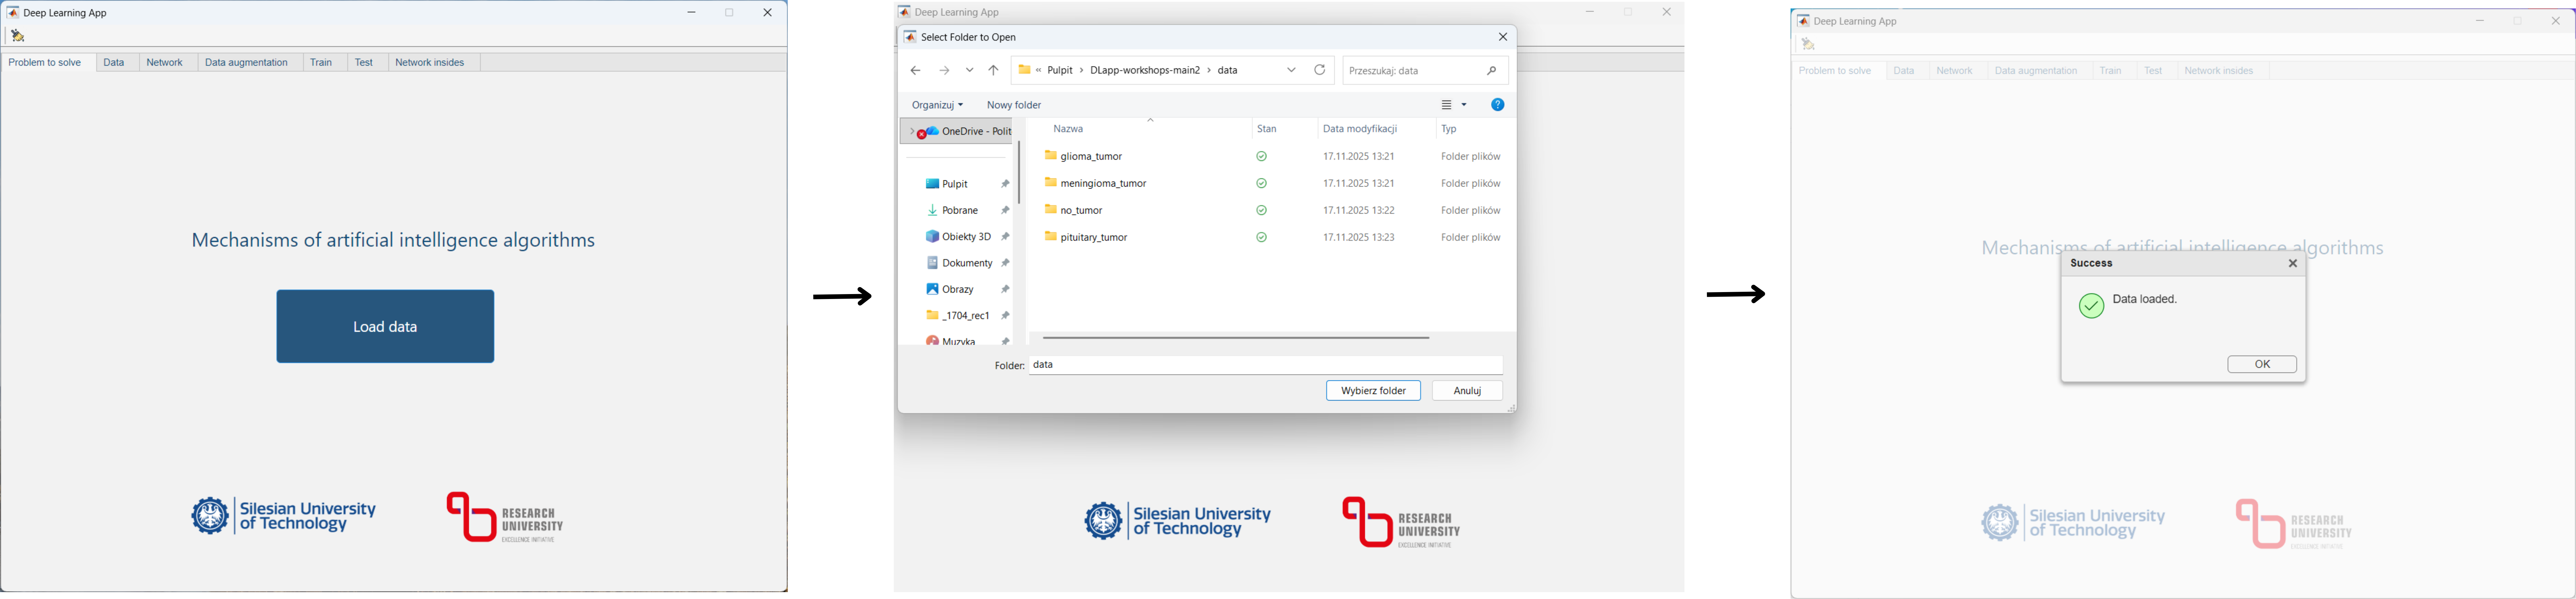
Run main.m file. Main window will appear. Click load data and point path to data folder. Now your data is loaded (and it should be apporved by .  


Partition the data into training, validation, and test datasets. You can leave default (0.8 – 0.1 – 0.1) values for now. Confirm the data partitioning using Apply partitioning button (wait a moment after clicking).


You can preview the datasets at the bottom part of a window.


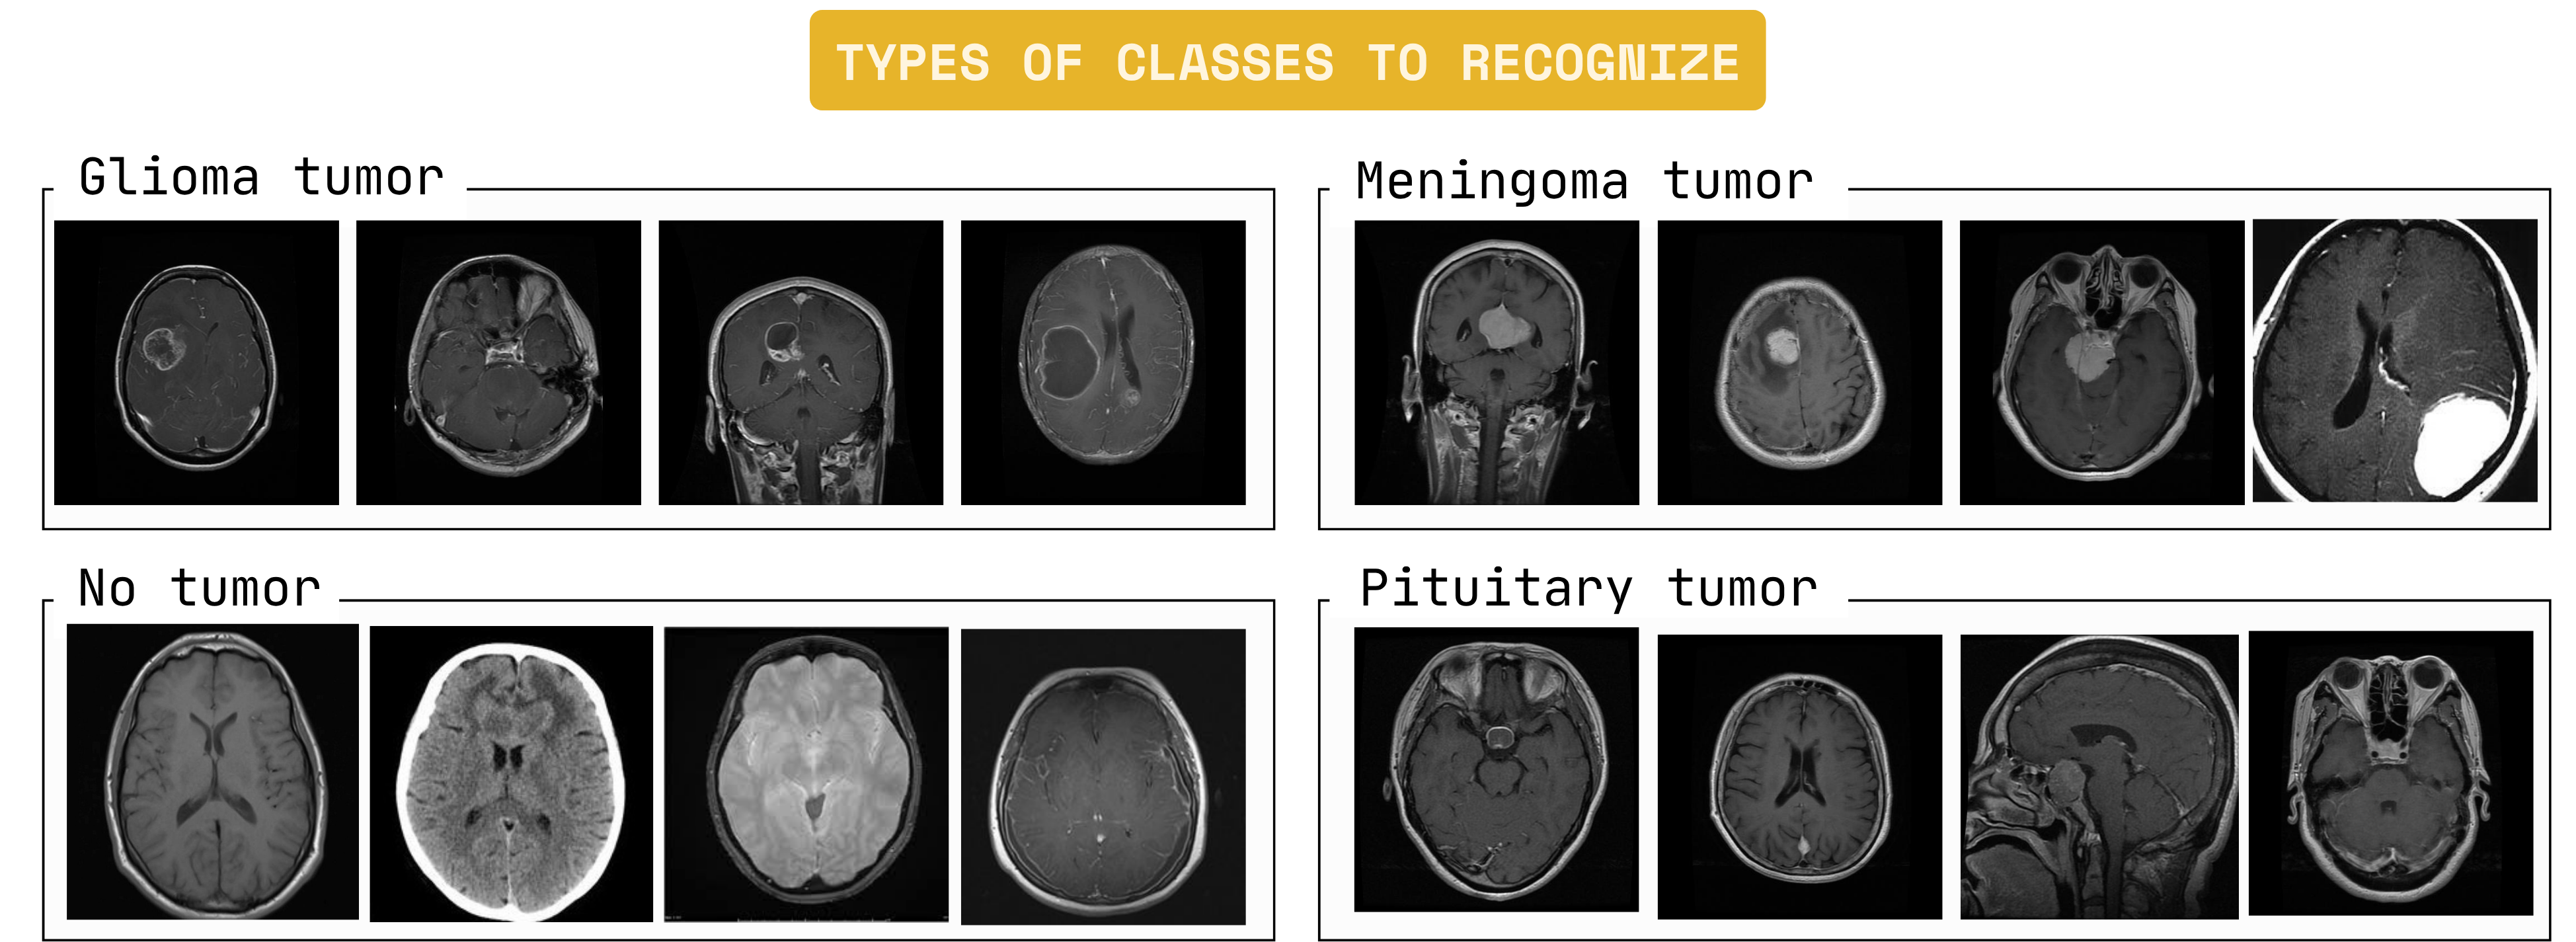
Now, select the network architecture. You can use a simple network or advanced, publicly available architectures (Inceptionv3, EfficientNet-B0, and ResNet-50). However, in this class we train only the simple classification network.

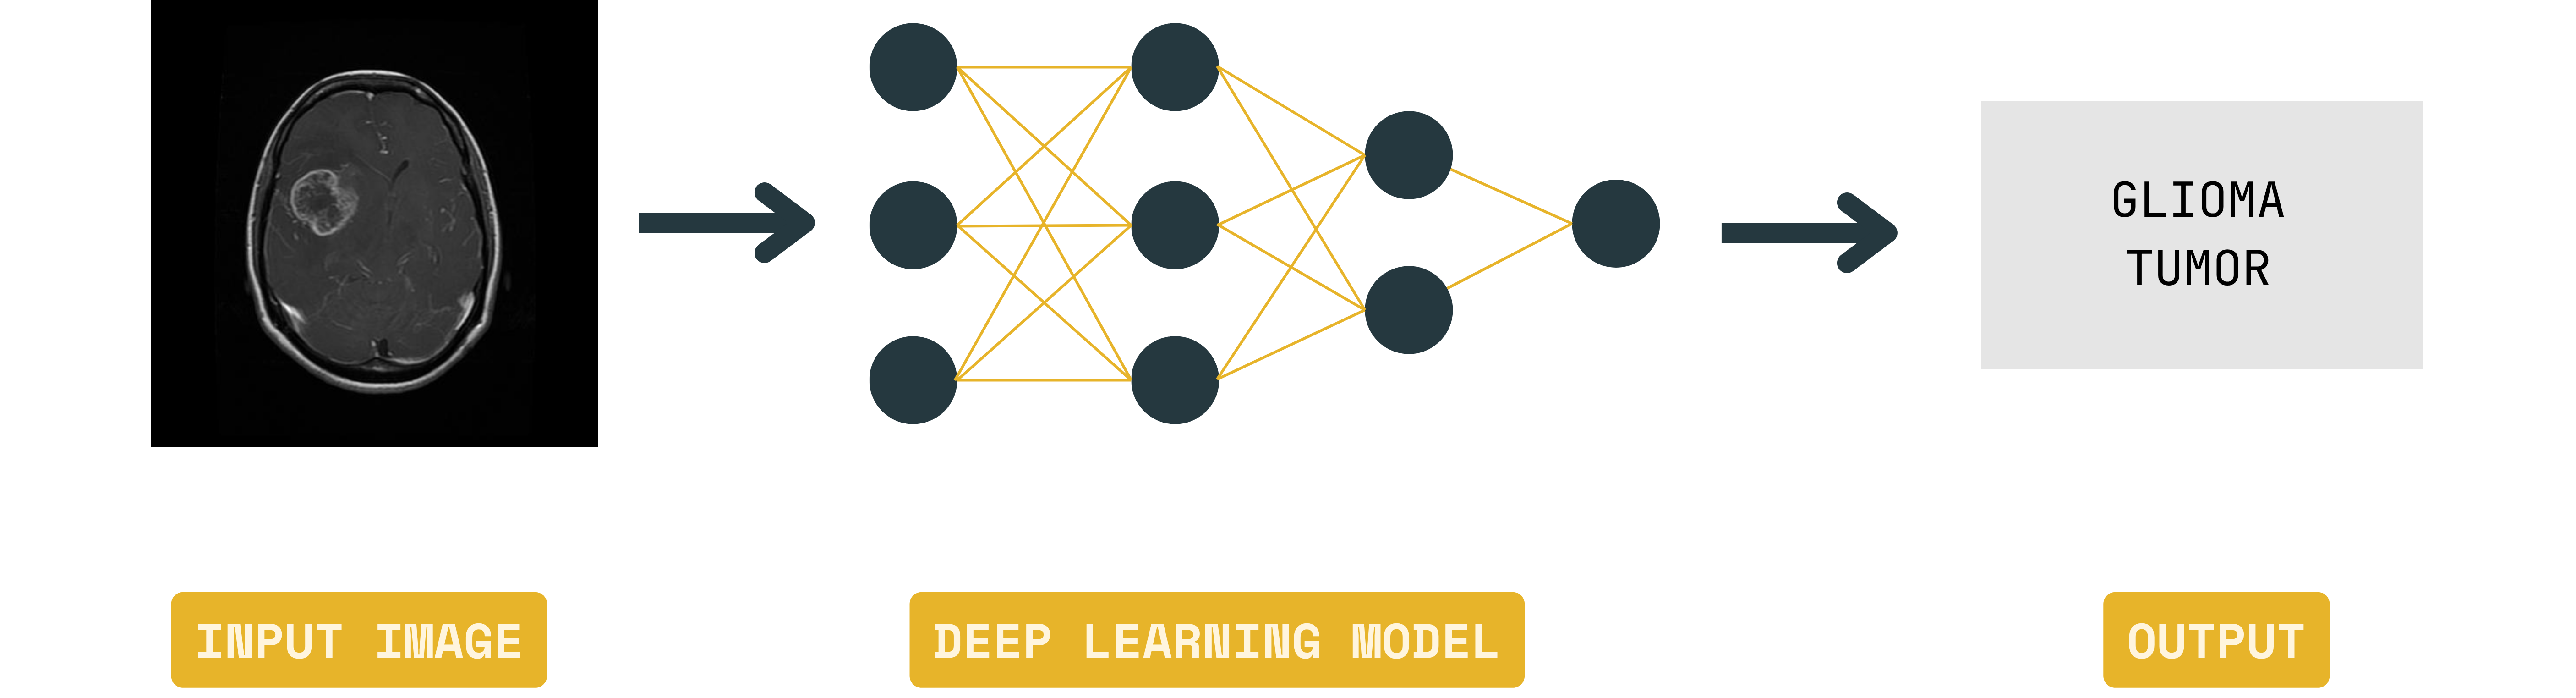
Enter the input image size (leave 3 in the “z” dimension, which corresponds to the three RGB image channels) and the number of classes, which is the number of disease types the network will recognize. You can leave default values.

Once all required fields are completed, click the Apply button. You can also preview the structure or chosen model at the right panel. 

The data augmentation panel contains a table listing the operations performed on images.The Value column is editable (data range can be changed). The Apply column indicates whether the operation is applied (when selected) or not (when the checkbox is unselected). The result of the augmentation, which uses the currently selected changes, is displayed at the bottom of the window. You can leave the default values.
 
To train a network, you must first select the optimizer, loss function, and hyperparameters. The selected values ​​are confirmed by pressing the Train button, which also begins the network training process (wait a moment for values ​​to begin appearing in the graphs on the right side of the window). Training can be interrupted and the network saved at any time.
 
For training of your networks use 10 epochs. 
 

The network testing panel allows you to check the accuracy of the trained model on a test set (one the network hasn’t seen before). The panel includes: a confusion matrix, metrics (accuracy, precision, sensitivity, F1 coefficient; the higher the value, the more effective the network), a preview of the test data in the upper right part of the window, along with expert descriptions (ground truth class) and those returned by the trained network (predicted class). It is also possible to generate a GradCAM map—visualizing which parts of the image had the greatest impact on the model’s decision.


This panel allows you to view the outcomes from individual layers of the selected network. These layers have different purposes and perform different mathematical operations on the images.


TASKS TO DO

Download the report

FILE TO REPLACE

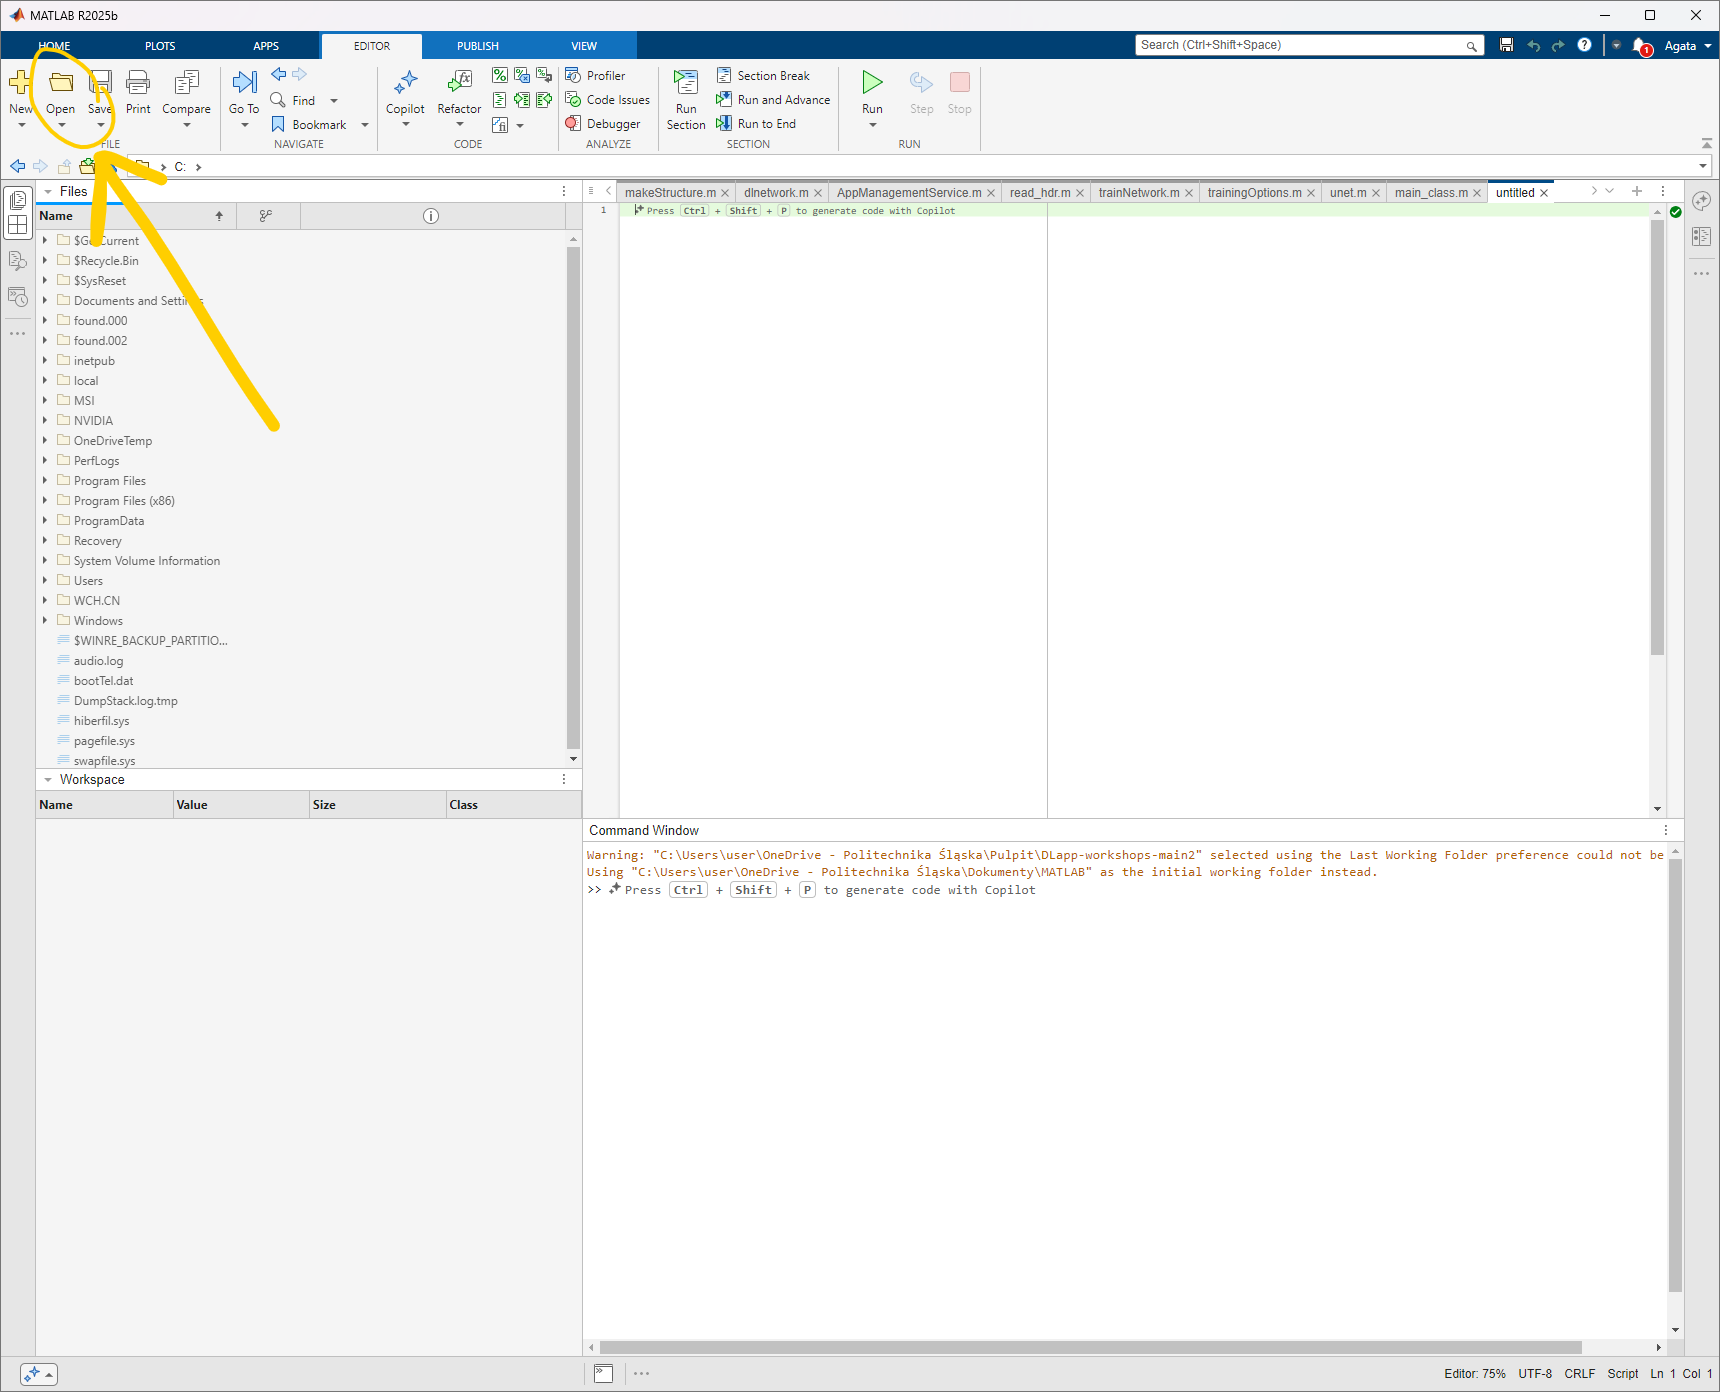
Find folder C:\Users\student\Documenty\FoB_AI_DL. Run Matlab 2025. Click Open function in Matlab (see picture below) and indicate path to FoB_AI_DL. Open main.m file and run (f5 or green triangle at the upper panel) it. 


  1. Give an example of classification, detection and segmentation tasks that can be solved using a convolutional neural network (CNN).

  2. Train the simple classification network several times (with different number of convolutional blocks). Use 3 nad 7 numbers of convolutional blocks. You can use any combination of number of filters in each convolutional block (8, 16, 32… up to 1024). Set number of epochs to 5.

  3. Test the ResNet-50, EfficientNet-B0, and Inceptionv3 models. They were all trained previously using 20 epochs. You can find them in Test Tab (drop-down list). To check how many weights has each of the models, go back to Network Tab and select (confirmed by Apply button) given model.

  4. Compare the results of simple classification models and advanced ones. Answer the questions in your report.

All the tasks are described in the report.

In case of any questions, let know the teacher!

© Politechnika Śląska

Polityka prywatności

Całkowitą odpowiedzialność za poprawność, aktualność i zgodność z przepisami prawa materiałów publikowanych za pośrednictwem serwisu internetowego Politechniki Śląskiej ponoszą ich autorzy - jednostki organizacyjne, w których materiały informacyjne wytworzono. Prowadzenie: Centrum Informatyczne Politechniki Śląskiej (www@polsl.pl)

Deklaracja dostępności

„E-Politechnika Śląska - utworzenie platformy elektronicznych usług publicznych Politechniki Śląskiej”

Fundusze Europejskie