


Animal Camouflage Analysis: CHAMELEON Database
C.H.A.M.E.L.E.ON – Cryptic Hidden Animals Masked in Environment, Labelled and Evaluated (-ON)
This work was led by Przemysław Skurowski. The database was crafted by the team of students (in alphabetical order): Hassan Abdulameer, Jakub Błaszczyk, Tomasz Depta, Adam Kornacki, Przemysław Kozieł.
Gliwice, 2017
Description
The following description contains some excerpts from an article manuscript by P. Skurowski, submitted for publication, entitled: ‘Relevance of saliency maps to the human perception for images of camouflaged animals‘.
Camouflage strategies in nature are evolutionarily developed concealment techniques for survival in both predator and prey species. They are intended to delay or even avoid observation or detection by other animals. These are crypsis, mimicry which can rely on vision, odor, sound and behavior. Here, the term crypsis requires explanation, ‘it comprises all traits that reduce an animal’s risk of becoming detected when it is potentially perceivable to an observer’. There are also other forms of camouflage which are not intended to hide an animal in a scene but to confuse the observer (e.g. zebra stripes) or behavioral strategies just clearly intended for hiding such as nocturnal or subterranean life activity. The camouflage techniques are within the scope of biological sciences which are then followed by humans in military applications which were notably developed since World War I, but that research is poorly disclosed to the public.
The database allows finding how well the saliency map suits to human perception of objects, or what is detector efficiency for the objects which are intended to be hidden in the scene. Since the topic is quite novel, it was necessary to perform some fundamental steps such as obtaining the ground truth a database of camouflaged animals which are then manually annotated and evaluated by independent respondents.
The data set was crafted manually. In order to avoid personal bias, authors five fellow students were asked to collect a pool of camouflaged animals images and manually annotate its areas. The images were taken from the Internet, selected using Google image search using the ‘camouflaged animal ‘ keyword. They were selected in order to present various camouflage efficiency – from animals clearly visible to almost invisible. Thanks to this a test pool was gathered, containing 76 photos (Fig. 2), which were taken by independent photographers who marked these as good examples of camouflaged animals. Next, image segments were annotated (Fig. 3) into four categories – C0 non-masking background (blue), C1 masking background (green), C2 masked foreground (black), C3 non-masked foreground (red).
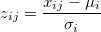
The online survey was prepared using the Google forms. The users were requested to evaluate the visibility of a hidden animal with a numerical scale from 1 to 5, where ends of the scale were described as ‘animal is in plain sight‘ and ‘what animal‘. The questionnaire form allowed to collect 191 answers from different countries. Then, in order to compensate personal bias, the raw responses were standardized using z-scores per person and then re-scaled backward to 1 to 5 scale. Z-scoring is computed as (where: i denotes user index, j denotes image index):
Next, outliers were filtered out with the use of Spearman rank order correlation coefficient (SROCC) between single subject responses and averaged responses for the whole set. All the respondents (6) having zero or negative correlation coefficient were removed as outliers. The final image evaluation is an average assessment by the respondents after above cleaning and standardization and back rescaling to 1 to 5, where these values are identified as the lowest and largest values of average z-score per image. For the test data in the attached spreadsheet file, there are also included z-score based average, standard deviation, skewness and kurtosis for each of the images. The dsitribution od scores is visible in Fig. 4, whereas the detailed visualization of all the evaluations is shown as a boxplot in Fig. 5.
Fig. 1 Respondents’ world part of origin

Downloads
The source images can be downloaded HERE.
The annotated masks are located HERE.
Evaluation responses are stored in Open Document SpreadSheet HERE and in Matlab HERE
If You use this database plese cite: …. * the work is to appear.
Contents
Below there are demonstrated miniature images and annotations in the database.


Fig. 4 Distribution of image evaluations in database

Fig. 5 Boxplot of evaluations scores for all the images in the database